Hello,
Your map is not very satisfactory. I suggest you inputting the following commands in Multiwfn after loading the .xyz file
20
-10
2
279-349
c
11
279-349
4 A
0.15
3
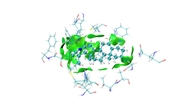
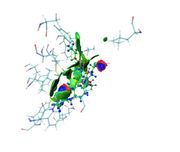
Then use igm_inter.vmd to render the cube files, and set isovalue to 0.003 and properly modify representation, then image looks nice:
Kindly, check your email
as you see in the last image there are some isosurfaces appeared within the amino acid residues, even though, I put 'Input index of the atoms to define a fragment, e.g. 2,3,7-10' around that for Ligand only.
Kindly, check and comment
Dear Lu
What is the reason for;
1- I finished mIGM analysis and trying to get the (Evaluate contribution of atomic pairs and atoms to inter-fragment interaction (atomic and atomic pair delta-g indices as well as IBSIW index))
2- Unfortunately, I couldn't get the same colors deep green for good interactions and blue is for atoms away from interaction.
I did the same as you mentioned;
First, plot color-filled isosurfaces using the IGM_inter.vmd script as mentioned earlier. After that, we need to remove the default representation showing molecular structure, so we enter "Graphics" - "Representation", choose the first term (its current style is CPK), click "Delete Rep" button. Then we drag the previously generated atmdg.pdb into VMD main window to load it. In this file the “occupancy” field records intermolecular interactions, to graphically exhibit its value for every atom, we should let VMD color the atoms according to their occupancy property. We enter "Graphics" - "Representation" again, set "Drawing method" to CPK, and set "Coloring method" to “Occupancy”,
then click "Trajectory" tab, set upper limit of color scale to 50 and press ENTER button, now the system in graphical window should look like below.
Note
Atomic pair delta-g indices and percentage contributions (zero terms are not shown)
5 351 : 19.556075 ( 2.50 % )
3 351 : 17.894879 ( 2.29 % )
193 350 : 16.489099 ( 2.11 % )
178 350 : 15.737952 ( 2.01 % )
12 350 : 14.503133 ( 1.85 % )
check the attached file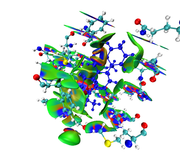
Thanks, Dear Lu
I will check email.
Thanks
I've sent to mm.mohammed@nrc.sci.eg
The new images look much more reasonable.
Dear Lu
I did not receive your email message, kindly try to resend the articles again.
emails:
melhenawy111@gmail.com
mm.mohammed@nrc.sci.eg
by the way check the following two images and send me your comments.
Thanks 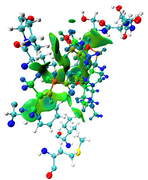
I already sent the two articles yesterday. You can directly reply my E-mail to provide your file.
Dear Dr. Lu
Thanks for your reply, How can i send you the file?, send me your email address.
Kindly. send me copy of the recent two articles for mIGM and amIGM. my email address is; melhenawy111@gmail.com
Regards
The maps look very weird. Perhaps the isovalue was not properly set (should be too small). Without your structure file I cannot reproduce your result and clearly answer this question.
Dear Lian
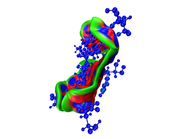
Here you can find the result of mine, as I understand from reading-out the manual regarding mIGM.
1- From the cluster analysis result I got the selected amino acid residues near the ligand and then save the file in .xyz containing one frame only and upload it to Multiwfn, then follow the steps of mIGM.
The results contain: 1) blue color for strong interactions like H-bond. 2) Green color for the noncovalent interactions like Van der Waals. 3) Red color for allosteric.
Is this result correct and my conclusion right?
Thanks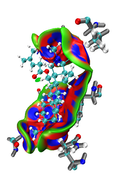
Dear Lian
As you mentioned that NCI is out-of-date and the best is
amIGM is the best method for characterizing dynamically averaged weak interactions. okay
if i will study for a single compound, should I use NCI or mIGM
Thanks, here you are my email address
melhenawy111@gmail.com
Dear Lian
One important thing, after I got the selected coordinates for a ligand and the surrounding amino acids in .xyz file for about 1000 frames usinf the following (same residue as within 3.5 of resname LIG or (not protein and not waters and not ions and not ion)) in VMD, when I used to open .xyz file with notepad++, I got that there are some water molecules and one Ion, so I remove all water molecules and ions from the .xyz file.
So the .xyz file will have only atomic coordinates for amino acids and ligandIs this, okay? or I should not remove the water molecules?
Kindly, reply for this matter.Thanks
If you only want to study interaction between amino acids and ligand, you can remove all other parts.
Dear Tian
Can you share me the above-mentioned manuscripts
Tian Lu, Graphically Revealing Weak Interactions in Dynamic Environments Using amIGM Method, Struct. Bond. (2025) https://doi.org/10.1007/430_2025_95
Tian Lu, Visualization Analysis of Covalent and Noncovalent Interactions in Real Space, Angew. Chem. Int. Ed., 137, e202504895 (2025) DOI: 10.1002/anie.202504895
As i don't have access to get it both.
Please show me your E-mail.
Dear Lian
One important thing, after I got the selected coordinates for a ligand and the surrounding amino acids in .xyz file for about 1000 frames usinf the following (same residue as within 3.5 of resname LIG or (not protein and not waters and not ions and not ion)) in VMD, when I used to open .xyz file with notepad++, I got that there are some water molecules and one Ion, so I remove all water molecules and ions from the .xyz file.
So the .xyz file will have only atomic coordinates for amino acids and ligand
Is this, okay? or I should not remove the water molecules?
Kindly, reply for this matter.
Thanks