You can properly set the positions of the three points, so that large enough plotting region is defined.
You can export positions of grid points and function values to a .txt file via corresponding option in post-process menu of main function 4, then you can use other software to replot the map. However, the data of vdW contour line cannot be exported.
Prof Tian, I have used three points to define the plane. I took the liberty to select three points to define such a plane that gives me the maximum atoms to be shown.
By the way, Can this plot be extracted to a script like matplotlib or gnuplot such that one can tweek through the setting?
I don't know how did you define the plotting plane. Increasing extension distance may be helpful, or you can try other ways to define the plotting plane, see Section 3.5 of Multiwfn manual for details.
Hi there, I tried to plot the ESP contour diagram of a molecule. It is not fitted inside the default print area. Let me show by this image.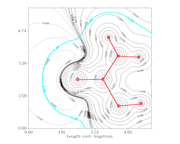
Are there an method by which I can fit the image inside the rectangle? Or can I increase the size of the rectangle?